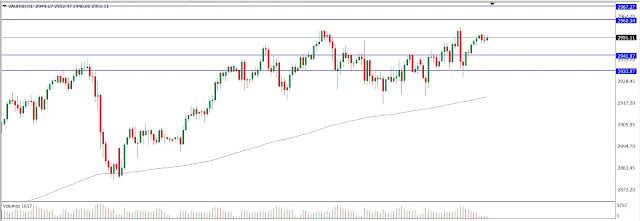
From a technical perspective, I see that Gold has entered a price level worth considering for potential entry points.
By analyzing historical candles, we can look for Buy entry opportunities, but to remain objective, I will present an analysis for both Buy and Sell entries.
On the chart, I have identified the Resistance area with lines above the price (2967.27 – 2960.34), and the Support area with two lines below the price (2941.87 – 2933.97).
Entry Setup Recommendations
You can adjust these setups according to your trading style.
Breakout Opportunity Setup:
- If the 1-Hour Candle closes above the Resistance Area (2967.27), prepare to look for the best Buy entry position.
- If the 1-Hour Candle closes below the Support Area (2933.97), prepare to look for the best Sell entry position.
- Cut Loss strategy:
- For a Buy entry, exit the trade if the 1-Hour Candle closes below the lower boundary of the resistance area (<2960.34).
- For a Sell entry, exit the trade if the 1-Hour Candle closes above the upper boundary of the support area (>2941.87).
- Use a minimum risk-reward ratio of 1:1.
Pullback Setup for Sell Entry:
- Use the Resistance area as the pullback reference.
- If the 1-Hour Candle closes within the pullback area, you may take a Sell position.
- Exit the trade (Cut Loss) if the 1-Hour Candle closes above the upper boundary of the pullback area (>2967.27).
- Use a minimum risk-reward ratio of 1:1 based on your trading strategy.
Pullback Setup for Buy Entry:
- Use the Support area as the pullback reference.
- If the 1-Hour Candle closes within the pullback area, you may take a Buy position.
- Exit the trade (Cut Loss) if the 1-Hour Candle closes below the lower boundary of the pullback area (<2933.97).
- Use a minimum risk-reward ratio of 1:1 based on your trading strategy.
Always apply good money management in every trade to maintain a healthy trading practice. Also, be cautious of Fake Breakout Candles.
I hope this analysis serves as a helpful reference for your market analysis.
Happy Trading, everyone! 🚀


.jpg)
.png)
.jpg)

.png)
.jpg)


