
From a technical perspective, Gold has reached a price level that remains worth considering for potential entry points.
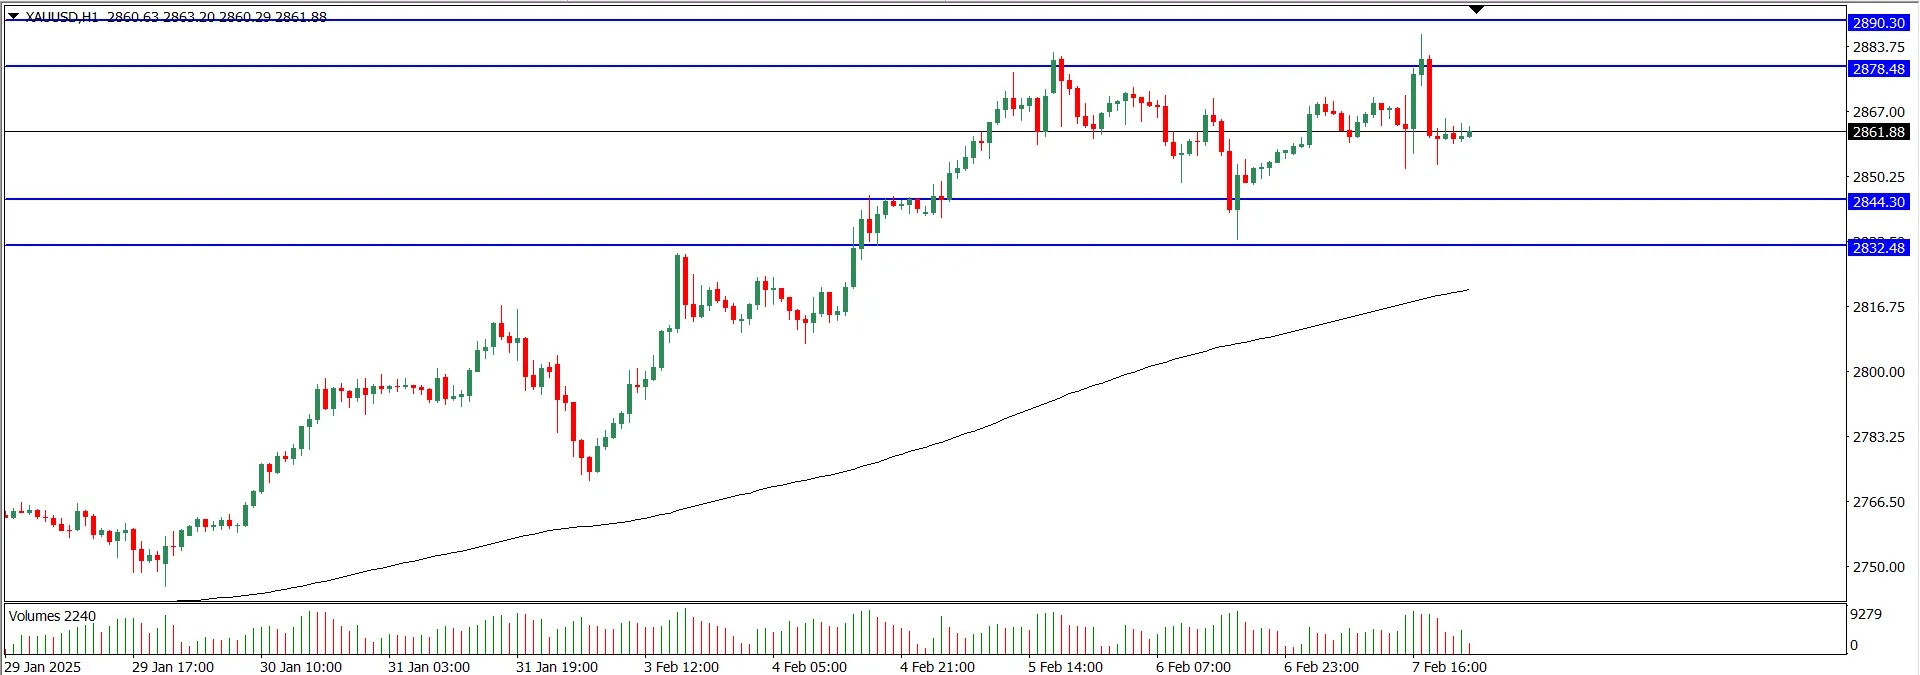
Let's take a look at the 1-Hour Time Frame Gold Chart before proceeding with the analysis:
Price Action Analysis (Trader Pressure Analysis)
The market trend indicates that GOLD is still in a Bullish/Uptrend condition. However, we must also anticipate a possible trend reversal if the price breaks the Support area or enters a consolidation phase.
Looking at the historical candlestick movements, we can identify potential Buy opportunities. However, for a more objective approach, I will present both Buy and Sell entry strategies.
Examining the chart, we observe that buyer pressure (long green candles) continues to push prices higher, while seller pressure (long red candles) remains weak, forming a Higher Low pattern. This suggests that buyers still dominate price formation at certain levels. Nevertheless, potential Sell opportunities also exist in the GOLD market.
I have identified the Resistance area with lines above the price at (2890.30 – 2878.48) and the Support area with lines below the price at (2844.30 – 2832.48).
Entry Setup Recommendations
Breakout Strategy:
- Buy Opportunity: If the 1-Hour candle closes above the Resistance area (2890.30), prepare to look for the best Buy entry.
- Sell Opportunity: If the 1-Hour candle closes below the Support area (2832.48), prepare to look for the best Sell entry.
- Stop Loss Guidelines:
- For Buy Entry: Cut loss if the 1-Hour candle closes below 2878.48.
- For Sell Entry: Stop loss if the 1-Hour candle closes above 2844.30.
- Maintain a minimum risk-reward ratio of 1:1.
Pullback Strategy:
Sell Setup:
- Utilize the Resistance area as a pullback zone.
- If the 1-Hour candle closes within the pullback area, a Sell position can be taken.
- Cut loss if the candle closes above 2890.30.
- Maintain a minimum risk-reward ratio of 1:1.
Buy Setup:
- Utilize the Support area as a pullback zone.
- If the 1-Hour candle closes within the pullback area, a Buy position can be taken.
- Cut loss if the candle closes below 2832.48.
- Maintain a minimum risk-reward ratio of 1:1.
Always apply proper money management in every trade to ensure healthy and sustainable trading practices. Stay vigilant against Fake Breakout Candles to avoid unnecessary risks.
Hopefully, this analysis serves as a useful reference for your market trading decisions.
Happy Trading, everyone!