
From a technical perspective, I observe that GOLD is currently positioned at a price level worth considering for potential entry points.
Let’s examine the 1-hour timeframe chart below before delving deeper into the analysis:
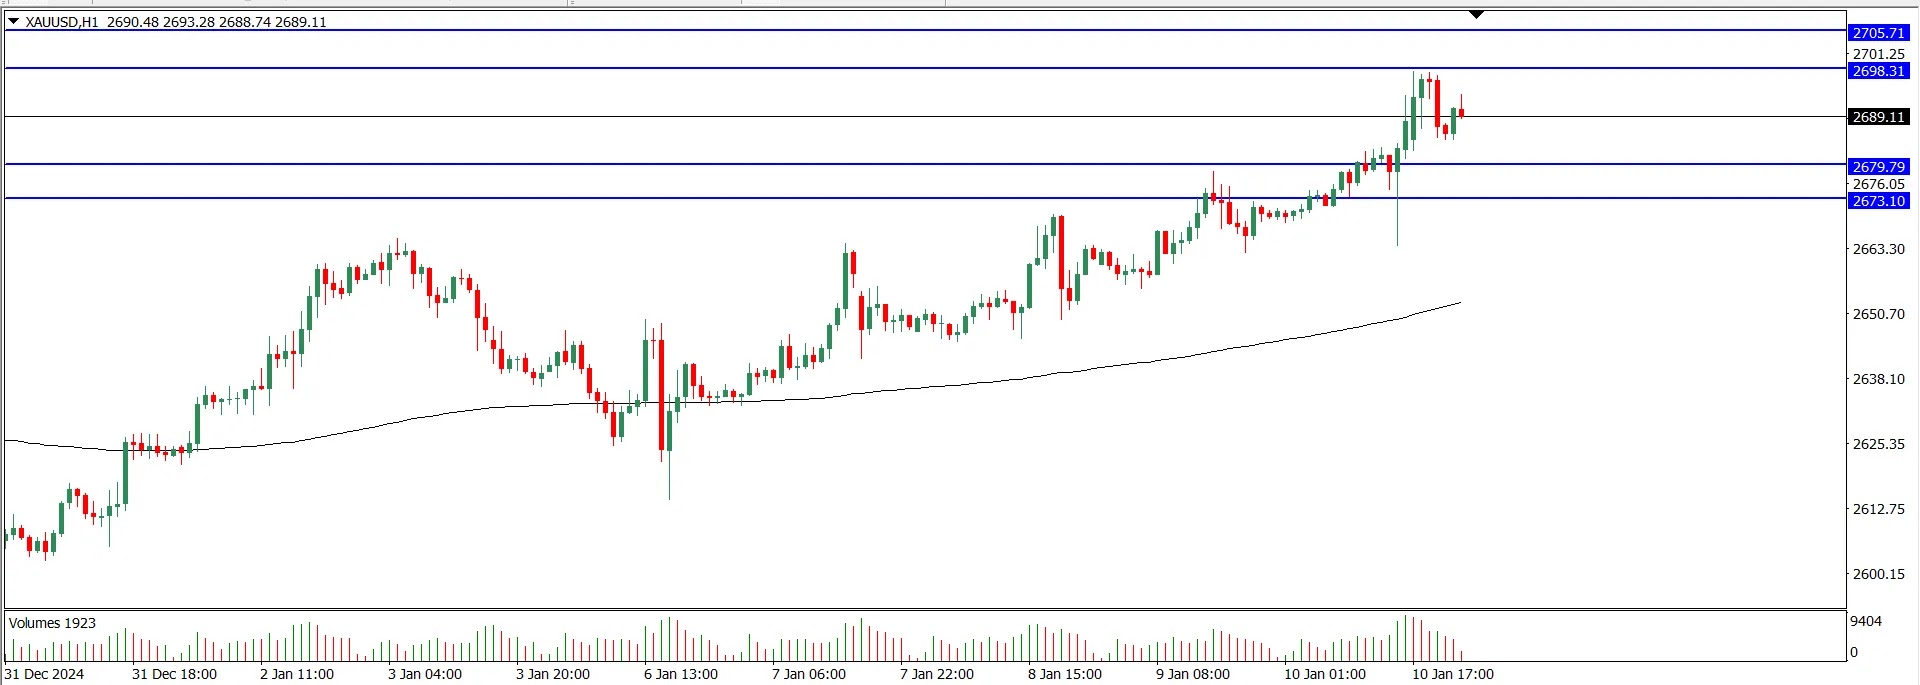
Using Price Action (Trader Pressure) as our method of analysis, GOLD appears to remain in a bullish trend/uptrend. However, it is crucial to anticipate a potential trend reversal if the price breaks through the support area or consolidates.
From the candlestick history, opportunities for a Buy entry are evident. To maintain objectivity, I’ll provide a detailed analysis for both buy and sell entry setups.
Looking at the chart, we can see that Buyer pressure (indicated by the long green candles) is gradually driving the price higher, with minimal resistance from Seller pressure (indicated by the shorter red candles), forming higher lows. This suggests that buyers are still dominating the formation of specific price levels. However, opportunities for a Sell entry remain possible in GOLD.
Key Levels:
- Resistance Area: Marked by two lines above the price (2705.71 – 2698.31).
- Support Area: Marked by two lines below the price (2679.79 – 2673.10).
My Entry Setup Options:
You can adapt these setups to suit your trading style:
1. Breakout Opportunity Setup:
- If the 1-hour candle closes above the Upper Resistance Level (2705.71), prepare to find the best Buy entry.
- If the 1-hour candle closes below the Lower Support Level (2673.10), prepare to find the best Sell entry.
- Use a Stop Loss:
- For a Buy entry, cut your loss if the 1-hour candle closes below the lower boundary of the resistance area (<2698.31).
- For a Sell entry, cut your loss if the 1-hour candle closes above the upper boundary of the support area (>2679.79).
- Maintain a minimum risk-to-reward ratio of 1:1.
2. Pullback Opportunity Setup for a Sell Position:
- Use the resistance area as the pullback zone.
- If the 1-hour candle closes within the pullback area, you can take a Sell position.
- Cut your loss if the 1-hour candle closes above the upper boundary of the pullback area (>2705.71).
- Maintain a minimum risk-to-reward ratio of 1:1, following your preferred trading strategy.
3. Pullback Opportunity Setup for a Buy Position:
- Use the support area as the pullback zone.
- If the 1-hour candle closes within the pullback area, you can take a Buy position.
- Cut your loss if the 1-hour candle closes below the lower boundary of the pullback area (<2673.10).
- Maintain a minimum risk-to-reward ratio of 1:1, aligned with your trading approach.
Always implement proper money management to ensure sustainable trading practices. Be cautious of fake breakout candles, which could mislead your analysis.