
From a technical perspective, I observe that Gold has entered a price range that remains worth considering for potential entry points.
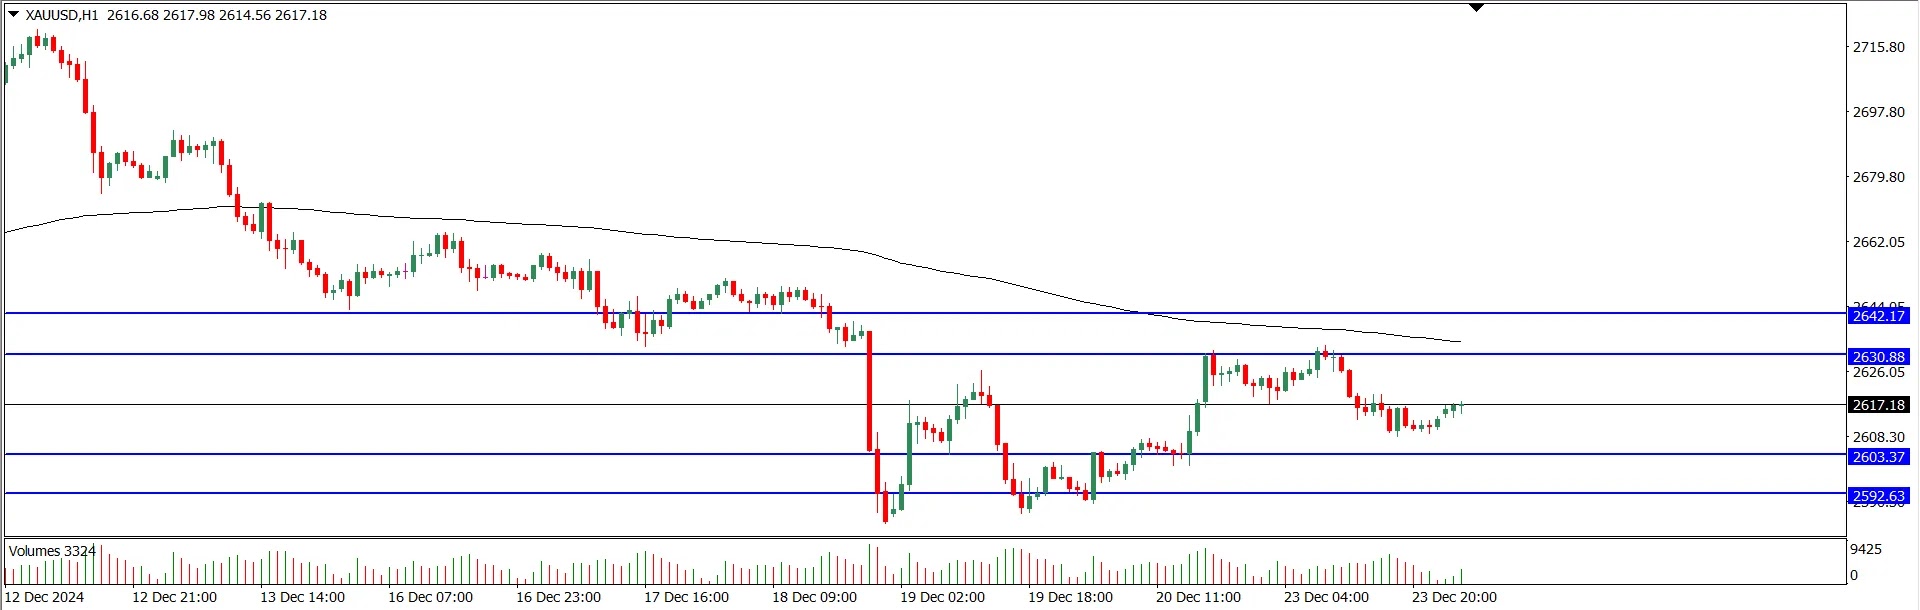
Let’s first take a look at the Gold chart on the 1-Hour Time Frame before diving into the analysis:
Analysis Using Price Action (Trader Pressure)
In the current market trend, Gold appears to remain in a Bullish/Uptrend condition. However, we should anticipate potential trend reversals if the price breaks through the Support area above, as well as price consolidations.
By reviewing the candlestick history, there are opportunities to look for Buy entries, but to remain objective, I will provide analysis for both Buy and Sell entries.
In the chart above, Buyer pressure (represented by the length of green candles) is gradually pushing prices higher, overpowering Seller pressure (red candles), and forming Higher Lows. This indicates that Buyers still dominate the formation of certain price levels. However, opportunities for Sell positions can still be found in Gold.
The chart highlights Resistance and Support areas as follows:
- Resistance Area: 2642.17 – 2630.88
- Support Area: 2603.37 – 2592.63
Suggested Entry Setups
Breakout Opportunity
- Buy Setup:If the 1-Hour candle closes above the Upper Resistance Area (2642.17), prepare to look for the best Buy entry position.
- Sell Setup:If the 1-Hour candle closes below the Lower Support Area (2592.63), prepare to look for the best Sell entry position.
- Cut Loss:
- For Buy entries, close positions if the 1-Hour candle closes below the Lower Resistance boundary (<2630.88).
- For Sell entries, close positions if the 1-Hour candle closes above the Upper Support boundary (>2603.37).
- Always use a minimum risk-reward ratio of 1:1.
Pullback Opportunity
- Sell Setup:Use the Resistance area as the Pullback zone. If the 1-Hour candle closes within the Pullback area, take a Sell position.
- Cut Loss: If the 1-Hour candle closes above the Upper Resistance boundary (>2642.17).
- Use a minimum risk-reward ratio of 1:1, following your trading style.
- Buy Setup:Use the Support area as the Pullback zone. If the 1-Hour candle closes within the Pullback area, take a Buy position.
- Cut Loss: If the 1-Hour candle closes below the Lower Support boundary (<2592.63).
- Use a minimum risk-reward ratio of 1:1, following your trading style.
Always practice good money management for sustainable trading and stay alert for Fake Breakout Candles.